
Interpreting visual data and presenting information clearly is a critical skill for academic growth and global communication. This skill is evaluated in the IELTS Writing Task 1 exam, making it an essential component of both the Academic and General Training modules.
This guide provides a comprehensive overview of IELTS Writing Task 1, covering its formats, question types, examples, useful tips, and common pitfalls to avoid.
Understanding IELTS Writing Task 1
Task 1 assesses your ability to interpret and present information effectively in 150 words within 20 minutes. The primary skills evaluated include:
- Interpreting Data: Accurately understanding and summarizing visual information or letter prompts.
- Organizing Content: Structuring responses with an introduction, overview or purpose, and key details.
- Language Proficiency: Demonstrating varied vocabulary, proper grammar, and cohesive expression.
Differences Between Academic and General Writing Task 1
The nature of Task 1 varies depending on whether you are taking the Academic or General Training IELTS exam:
- Academic Task 1: Summarizing data from graphs, charts, tables, diagrams, or processes.
- General Task 1: Writing a formal, semi-formal, or informal letter based on a given situation.
IELTS Academic Writing Task 1
In the Academic module, you’ll interpret data from one or more visual elements. The common question types include:
- Table Charts
- Bar Graphs
- Line Graphs
- Pie Charts
- Map Diagrams
- Process Diagrams
- Mixed Charts
Practicing with IELTS Writing Task 1 sample tests will help you familiarize yourself with these formats.
Sample Questions and Answers
-
Table Chart Example
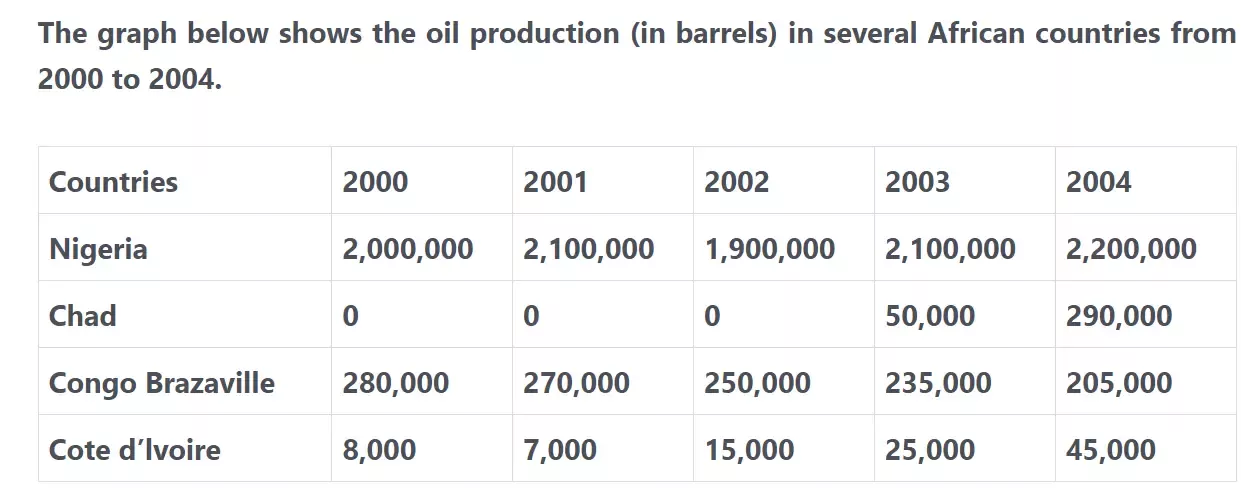
Question:The table shows oil production (in barrels) in several African countries from 2000 to 2004. Summarize the key features and make comparisons.
 Answer:
The table compares oil production in four African countries from 2000 to 2004. Nigeria consistently recorded the highest production, while trends varied across other countries.
Chad produced no oil until 2003, reaching 290,000 barrels by 2004. Cote d’Ivoire’s production rose from 8,000 barrels in 2000 to 45,000 in 2004. Conversely, Congo Brazzaville’s production declined steadily, falling from 280,000 barrels in 2000 to 205,000 in 2004. Nigeria’s production fluctuated but ultimately increased to 2.2 million barrels by 2004. -
Bar Chart Example
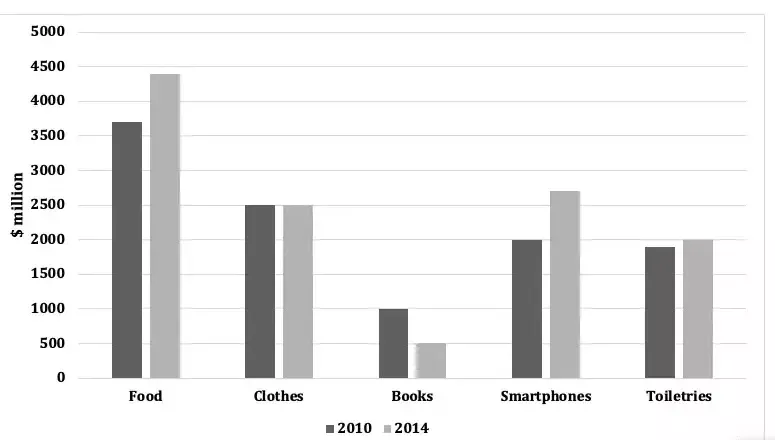
Question: The bar chart shows spending (in millions) by 18-20 year-olds on five products in 2010 and 2014. Summarize the data and compare key points.
 Answer:
The bar graph highlights spending trends of 18-20-year-olds on food, clothes, books, smartphones, and toiletries. Spending on food saw the highest increase, while expenses for books dropped significantly.
Food spending rose from $3,700 million in 2010 to $4,300 million in 2014, while smartphone purchases increased significantly. Spending on clothes remained unchanged, and books saw a sharp decline, falling to nearly half their initial amount. -
Pie Chart Example
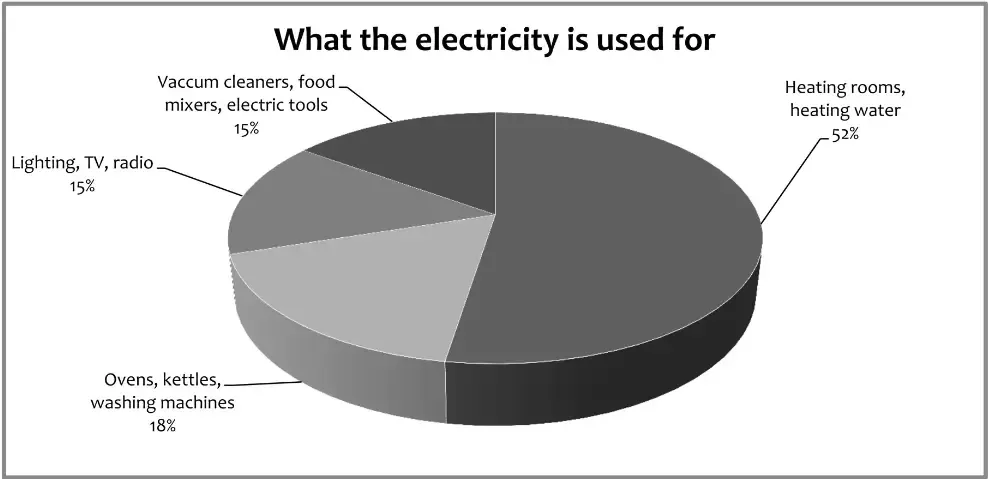
Question:The pie chart shows electricity use in an average English household. Summarize and report the main features.
 Answer:
The chart reveals that 52.5% of electricity in English homes is used for heating rooms and water, followed by kitchen appliances (17.5%). The remaining 30% is split between lighting, entertainment devices, and occasional-use appliances.
This heavy reliance on heating is influenced by the UK’s cool climate, where temperatures rarely exceed 20°C during summer. -
Line Graph Sample
The graph below illustrates the changes in birth and death rates in New Zealand from 1901, with projections extending to 2101.
Summarize the key features, make comparisons where relevant, and write at least 150 words.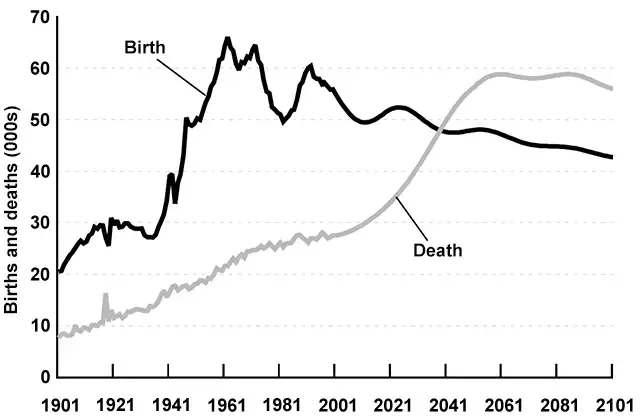
Sample Answer
The graph presents historical data and future trends for birth and death rates in New Zealand, spanning the period from 1901 to 2101.
Overall : The trends suggest that the death rate will surpass the birth rate around 2041, reversing the historical pattern where births significantly outnumbered deaths. This reversal will lead to a narrowing gap between the two rates in the latter part of the century.
Analysis of the Birth Rate : From 1901 to the present day, the birth rate has consistently exceeded the death rate. Initially, it stood at 20,000 in 1901 and rose steadily, reaching a peak of 66,000 in 1961. Following this peak, the birth rate has fluctuated between 65,000 and 50,000. Projections indicate a gradual decline, with the rate expected to fall to approximately 45,000 by 2101.
Analysis of the Death Rate : In contrast, the death rate started much lower, below 10,000 in 1901, and has steadily increased over time. Between 2021 and 2051, this growth is forecasted to accelerate significantly, eventually leveling off at around 60,000. By 2101, the death rate is expected to experience a slight decline.
The graph highlights a significant demographic shift for New Zealand, with the death rate surpassing the birth rate mid-century and altering the historical dynamics of population change. These trends emphasize the importance of understanding and preparing for such societal changes. -
Process Diagram Example
Question:The diagram illustrates the brick-making process. Summarize and describe the key stages.
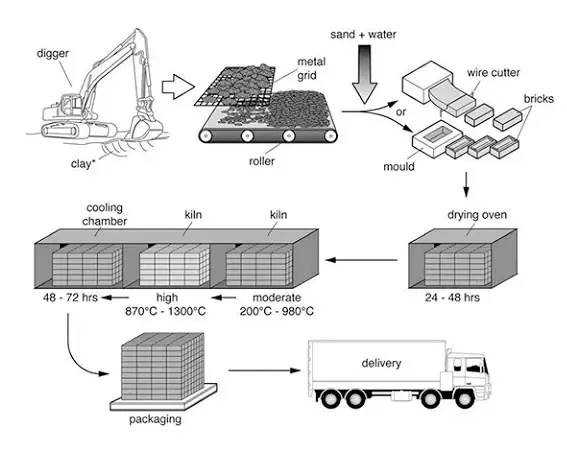 Answer:
The brick-making process involves seven stages, starting with clay extraction and ending with delivery. Clay is extracted, processed, molded, dried, and baked in kilns before cooling and delivery.
-
Map Diagram Labelling Sample
Question :The maps showcase the current industrial zone in Norbiton and a proposed redevelopment plan for the site.
Summarize the key features, make comparisons where relevant, and write at least 150 words.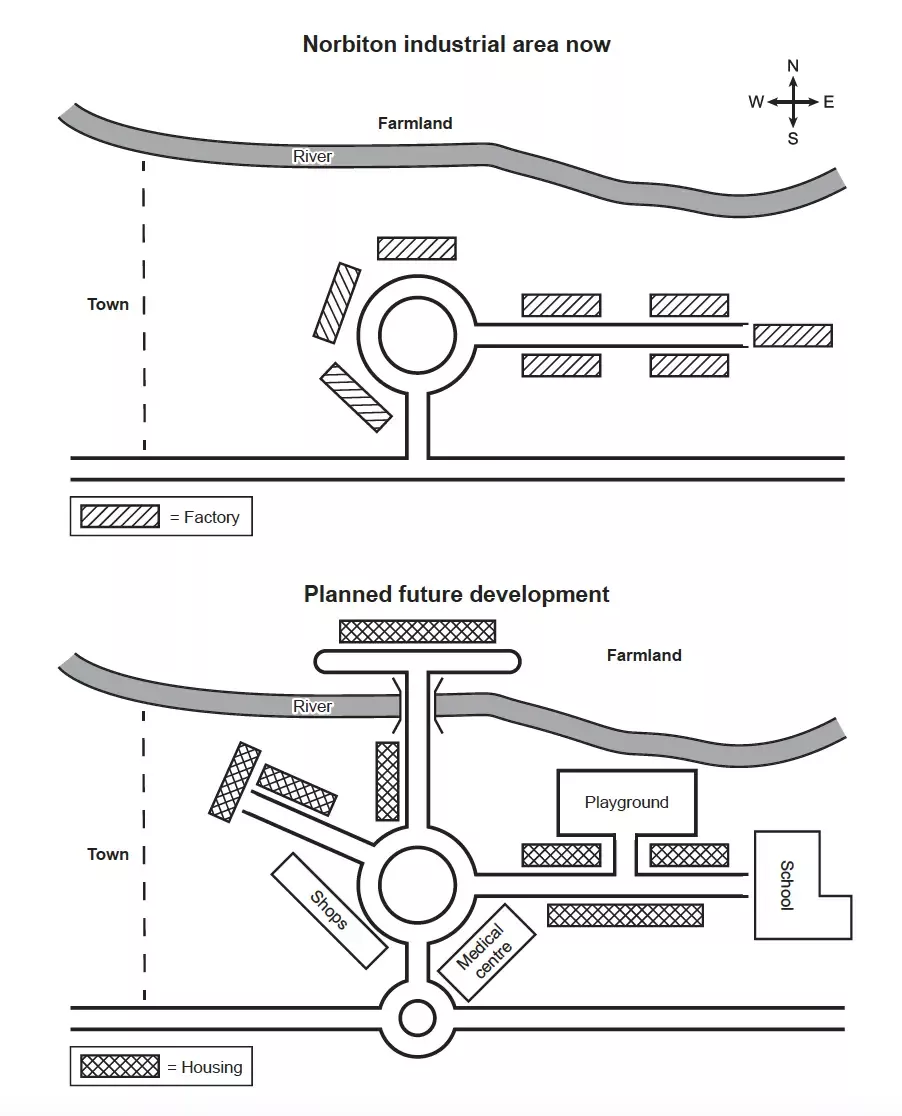
Sample Answer
The maps depict the present layout of Norbiton’s industrial area and a future plan to transform the site into a residential zone.
Overall : The redevelopment scheme aims to replace existing factories with housing, creating a more residential environment. New infrastructure including roads, a roundabout, shops, a school, and a medical center is also part of the plan.
Current Layout : At present, the main road runs east to west, with a central roundabout surrounded by factories that extend further east. To the north of the industrial area lies farmland across a river. There are no residential or public facilities in the current setup.
Future Redevelopment : In the redevelopment plan, a new road will extend northward from the roundabout, crossing the river via a bridge to provide access to housing on the farmland. Another road will branch northwest, lined with houses and shops. A medical center is planned near the new mini roundabout. To the east, additional residential areas will be complemented by a school and playground. Notably, all factories will be removed.
The proposed redevelopment will drastically transform Norbiton from an industrial hub into a residential community, with improved infrastructure and facilities for future residents. -
Combination Charts Sample
Question :The graph below illustrates CO2 emissions for various transport modes in the European Union, while the pie chart shows the allocation of EU funds for different transport types.
Summarize the main features, make comparisons where relevant, and write at least 150 words.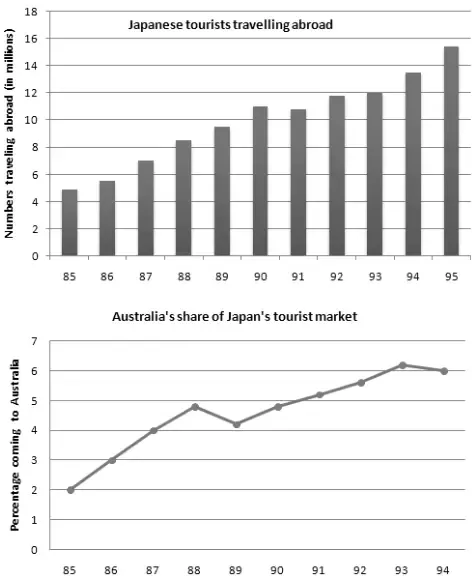
Sample Answer
The bar chart details the CO2 emissions generated by different modes of transport in the European Union, while the pie chart highlights the percentage of EU funds allocated to these transport types.
Overall: While road transport is the largest contributor to CO2 emissions, it also receives the highest funding. Other transport types like rail and sea have comparatively lower emissions but receive a smaller proportion of funds.
CO2 Emissions by Transport Mode : Road transport accounts for the highest emissions, significantly exceeding other categories. Air transport is the second-largest contributor, followed by sea and rail transport, which have notably lower emissions.
EU Transport Funding : The pie chart reveals that road transport also receives the largest share of EU funds, reflecting its dominance in usage. Rail transport, despite lower emissions, receives a moderate share of funding. Sea and air transport account for the smallest proportions of EU transport budgets.
The data highlights a correlation between higher emissions and increased funding allocation, particularly for road transport, emphasizing its prominence in the EU transport system.
IELTS General Writing Task 1
In the General Training module, candidates must write a letter addressing a situation or problem. The three types of letters are:
Formal Letter Sample
You dined at a restaurant and had a terrible experience, prompting you to inform the manager about what happened and request a refund. Below is a sample letter addressing the issue.
Sample Answer
Dear Sir,
I regret to inform you about my disappointing experience at your restaurant last night. Despite having made a reservation two months in advance for a major professional event, we were told upon arrival by the maitre d’ that there were no large enough tables available, forcing us to dine separately. I explained that my party needed to stay together, but was informed that it was not possible to accommodate us.
Additionally, several menu items, including all vegetarian options, were unavailable. As a result, three members of my party were left with only bread for the entire meal. Due to these issues, I initially intended not to pay, but your staff threatened to call the police if we refused, leaving me with no choice but to comply in order to avoid further embarrassment.
This experience was entirely unacceptable, and I request a full refund of the amount paid. I also suggest that your staff refrain from promising services they are unable to deliver to avoid such disappointing experiences in the future.
Regards,
Paul Hollywood
Semi-formal Letter Sample
You moved to a new country and want to update your former colleague about your new job and life. You also invite them to visit. Here’s a sample letter.
Sample Answer
Dear Rohan,
I hope this letter finds you well. I wanted to let you know that I’ve recently moved to Brussels to work as a Senior Consultant in Java at ABC Company, one of the most prestigious firms here. I consider myself fortunate to have been selected for this role.
Life in Brussels has been fantastic so far. The climate is maritime temperate, with warm summers and cool winters. The city enjoys a generally pleasant climate due to its proximity to the Atlantic Ocean, though snowfall is rare. Brussels has a highly diverse population, with nearly 70% of its residents having foreign origins. I plan to stay here for at least the next ten years, provided all goes well.
Knowing your strong background in Java, I think there are plenty of opportunities for you in Brussels. If you’re interested, I can arrange an interview for you at ABC Company. Please send me your resume. Regardless of that, you’re always welcome to visit me for a holiday. Brussels is a wonderfully artistic city.
Looking forward to hearing from you soon.
Yours truly,
Samuel
Informal Letter Sample
A friend from abroad plans to visit you, but you are not available on the requested date. Below is an informal letter offering an alternate date.
Sample Answer
Dear Reeta,
I received your message about your visit to my city, and I’m absolutely thrilled that you’re coming! However, I need to apologize as I won’t be available on the date you mentioned, 25th February.
Unfortunately, I have my final exam on that day, and I will be out of the city for the entire day. I truly wish I could be there to greet you as I’ve been looking forward to meeting you for months.
Would it be possible for you to adjust the visit date? I’ll be free anytime after the 25th, and you are more than welcome to stay with me for as long as you’d like. We’ll have an amazing time together. Once again, I apologize for the inconvenience.
Looking forward to seeing you soon!
Yours lovingly,
Sheela
Evaluation Criteria for IELTS Writing Task 1
The purpose of the IELTS Writing Task 1 question is to assess a candidate’s writing abilities. Four criteria are used to assess a candidate’s IELTS score:
- Task Achievement
- Coherence & Cohesion
- Lexical Resource
- Grammatical Range & Accuracy
For IELTS Writing Task 1, each component is worth 25% of the candidate’s final score. Therefore, these are standardized measures that a student needs to follow throughout their answer to achieve their desired IELTS band score.
| Band Score | Task Achievement | Coherence & Cohesion | Lexical Resource | Grammatical Range & Accuracy |
|---|---|---|---|---|
| 9 |
|
|
|
|
| 8 |
|
|
|
|
| 7 |
|
|
|
|
| 6 |
|
|
|
|
| 5 |
|
|
|
|
Top Tips for Success in IELTS Writing Task 1
Excelling in IELTS Writing Task 1 requires a combination of preparation, practice, and strategy. Whether you’re tackling the Academic or General Training (GT) version, following these tips can help you structure your response effectively and maximize your score.
Understand the Task Requirements : Start by carefully reading the instructions. Identify the main features, key trends, and essential data points in the visual or prompt provided. This foundational step ensures you know exactly what is expected in your response.
Plan Your Response : Take a few minutes to organize your ideas before writing. Create a mental or written outline to help you structure your response logically. This saves time and avoids a disorganized answer.
Use a Variety of Vocabulary : Avoid repetitive language by incorporating synonyms and descriptive phrases. For example, instead of repeating “increase,” use words like “rise,” “grow,” or “surge” to demonstrate your lexical range.
Focus on Significant DetailsHighlight key information from the data provided. Avoid overwhelming the examiner with excessive details that don’t contribute to the overall understanding of the trends or patterns.
Practice Time ManagementAllocate approximately 20 minutes to complete Writing Task 1. Spend 3–5 minutes analyzing the data and planning, 12–14 minutes writing, and 2–3 minutes reviewing and editing.
Use Synonyms: Paraphrase the prompt with your own vocabulary instead of copying it directly.
Include Units of Measurement: Mention units like percentages, millions, dollars, or tons to show attention to detail and accuracy.
Use Linking Words: Connect your ideas using words like “while,” “however,” “in addition,” or “on the other hand” to ensure cohesion.
Stick to Plain English: Avoid overcomplicating your language. Focus on clarity and simplicity.
Additional Tips
Common Mistakes to Avoid in IELTS Writing Task 1
While Writing Task 1 may seem straightforward, several pitfalls can impact your score. Avoid these common errors to enhance your performance:
Misinterpreting Data or Prompts : Ensure you accurately understand the data or visual information. Misinterpretation can lead to incorrect or irrelevant responses.
Ignoring Task Instructions : Adhere strictly to the task requirements. Stay focused on the topic and avoid deviating from the instructions provided.
Overlooking Grammar and Spelling : Proofread your work to eliminate errors in grammar, punctuation, and spelling. These mistakes can significantly impact your score.
Lack of Coherence and Cohesion : Structure your response with clear paragraphs and logical connections between ideas. Use cohesive devices to guide the examiner through your argument.
IELTS Writing Task 1 might feel challenging, but with consistent practice and strategic preparation, you can succeed. Focus on understanding the format, improving your grammar and vocabulary, and analyzing various types of data. For expert guidance, join an IELTS webinar or consult an IELTS coach. Remember, success comes with effort, so start preparing and aim for your desired band score!


 Here can be your custom HTML or Shortcode
0 Comments