


IELTS Writing Task 1: Understanding Line Graphs
In the IELTS Academic Writing Task 1, you are required to write a report based on a visual representation such as a diagram or a graph. One common type of graph is the line graph, which illustrates how data changes over time. Line graphs typically feature two axes: the X-axis (time periods) and the Y-axis (values being measured).
Types of Line Graphs in IELTS
1. Simple Line Graph
A simple line graph has just one line representing the data. For example:
You should spend about 20 minutes on this task. Write a report for a university lecturer describing the information in the graph below. Summarise the information by selecting and reporting the main features, and make comparisons where relevant. Write at least 150 words.
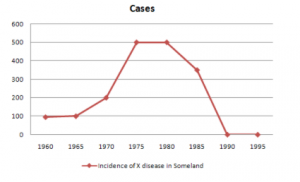
The provided graph illustrates the trend in the prevalence of X disease in Someland from 1960 to 1995.
The chart shows how the number of cases fluctuated over the years before the disease was entirely eliminated.
Initially, from 1960 to 1965, the number of individuals affected remained below 100. After 1965, the cases began to rise, reaching 200 by 1970 and further increasing to 500 by 1975. Between 1975 and 1980, the number of cases plateaued at 500. However, after 1980, a decline in cases is observed, dropping to around 350 by 1985. By 1990, X disease was completely eradicated, with no reported cases from 1990 through 1995.
2. Multiline Graph (Polyline Graph)
Multiline graphs include multiple lines on the same axis, often used for comparisons. For instance:
You should spend about 20 minutes on this task. The graph below shows the consumption of three spreads from 1981 to 2007. Summarise the information by selecting and reporting the main features, and make comparisons where relevant. Write at least 150 words.
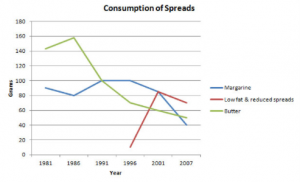
The graph illustrates the consumption trends of three types of spreads—margarine, low-fat and reduced spreads, and butter—over a 26-year period from 1981 to 2007.
Initially, butter and margarine were the most widely consumed spreads until low-fat and reduced spreads were introduced.
From the early 1980s to the early 1990s, butter was the dominant choice. Margarine’s consumption showed fluctuations during this period, decreasing between 1981 and 1986, then increasing until 1991, before stabilizing from 1991 to 1996 and eventually declining. Low-fat and reduced spreads entered the market in 1996, experiencing a sharp rise in consumption until 2001, after which their popularity began to decline.
In terms of quantity, butter peaked at around 160 grams before steadily decreasing. Margarine consumption remained between 80 and 100 grams for about two decades until 2001, then dropped to 40 grams by 2007. Low-fat and reduced spreads surpassed 80 grams in 2001 but saw a decline in consumption thereafter.
3. Compound Line Graph
Compound line graphs add a shaded area between lines to highlight differences in size.
Example:
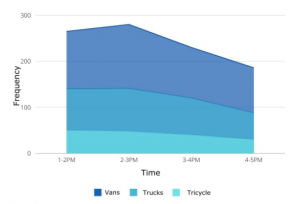
The graph depicts the frequency of three types of vehicles—vans, trucks, and tricycles—on a road at various times throughout the day.
From the graph, it is evident that vans consistently have the highest frequency on the road, followed by trucks, with tricycles being the least common. The peak time for both vans and trucks occurs between 2-3 pm.
The number of vans on the road increases from 1-2 pm to 2-3 pm, then gradually declines afterward. The truck count remains steady until 2-3 pm, after which it starts to decrease. Tricycles, on the other hand, are most frequent between 1-2 pm and then follow a downward trend for the rest of the day.
Overall, vans dominate the road for most of the day, with trucks being common in the afternoon. Tricycles are far less frequent compared to the other two vehicle types.
Tips for Tackling IELTS Line Graphs
- Start your introduction by paraphrasing the given question or topic.
- In the overview, summarize the main trends or key features of the graph.
- Support your explanation with specific data points like percentages or numbers.
- Use varied vocabulary, including verbs (increase, decline), adjectives (sharp, steady), and adverbs (gradually, significantly).
- Practice regularly to gain confidence and clarity.
The key to mastering IELTS Writing Task 1 is practice, precision, and clear presentation.


 Here can be your custom HTML or Shortcode
0 Comments