


Question:
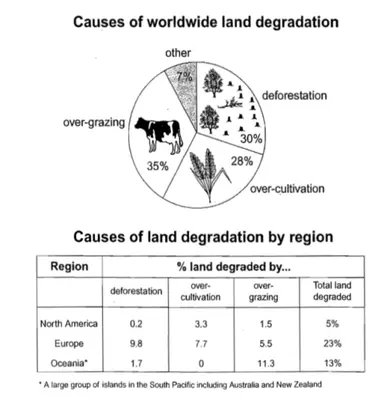
The pie chart below shows the main reasons why agricultural land becomes less productive. The table shows how these causes affected three regions of the world during the 1990s. Summarise the information by selecting and reporting the main features, and make comparisons where relevant.
Band 9 Answer
The pie chart illustrates the primary causes of agricultural land degradation worldwide, while the table presents data on how these factors affected North America, Europe, and Oceania in the 1990s. Overall, over-grazing was the leading cause of land degradation globally, followed by deforestation and over-cultivation. Regionally, Europe had the highest percentage of degraded land, whereas North America was the least affected.
According to the pie chart, over-grazing accounted for the largest proportion of land degradation at 35%, closely followed by deforestation at 30%. Over-cultivation contributed to 28%, while other unspecified causes made up the remaining 7%.
The table reveals that Europe experienced the highest total land degradation at 23%, with deforestation (9.8%) and over-cultivation (7.7%) being the major contributors. Oceania had 13% of its land affected, primarily due to over-grazing (11.3%), as over-cultivation was not a significant factor. In contrast, North America had the lowest total degradation at only 5%, with over-cultivation (3.3%) being the leading cause, while deforestation (0.2%) had minimal impact.
These figures highlight that while over-grazing was the predominant cause worldwide, different regions were affected by varying factors, with Europe suffering the highest overall degradation and North America the least.
Vocabulary
- Illustrates
- Primary causes
- Proportion
- Contributed
- Reveals
- Predominant
- Minimal impact
- Affected
- Significant
- Varying factors
Band 8 Answer
The pie chart displays the main reasons why agricultural land becomes less productive globally, while the table provides a breakdown of how these factors impacted North America, Europe, and Oceania in the 1990s. Overall, over-grazing was the biggest contributor to land degradation worldwide, while Europe had the highest proportion of degraded land.
From the pie chart, over-grazing accounted for 35% of global land degradation, making it the most significant factor. Deforestation was responsible for 30%, while over-cultivation caused 28%. Other reasons made up the remaining 7%.
In terms of regional differences, Europe had the highest total land degradation at 23%, with deforestation (9.8%) and over-cultivation (7.7%) being the most damaging factors. Oceania had 13% of its land affected, mainly due to over-grazing (11.3%), while North America had the lowest degradation rate at only 5%, where over-cultivation (3.3%) was the main cause.
In summary, while over-grazing was the biggest factor worldwide, regional variations were evident, with Europe suffering the most significant impact and North America the least.
Vocabulary
- Displays
- Breakdown
- Contributor
- Proportion
- Responsible
- Damaging factors
- Rate
- Variations
- Most significant
- Impact
Band 7 Answer
The pie chart shows the main reasons for agricultural land degradation worldwide, while the table provides data on how these factors affected three different regions in the 1990s. Overall, over-grazing was the biggest factor worldwide, and Europe had the most degraded land.
The pie chart indicates that over-grazing caused 35% of land degradation globally, followed by deforestation (30%) and over-cultivation (28%). Other causes accounted for 7%.
Looking at regional data, Europe had the highest land degradation at 23%, mainly due to deforestation (9.8%) and over-cultivation (7.7%). Oceania had 13% of its land affected, mostly by over-grazing (11.3%). North America had the lowest degradation at 5%, where over-cultivation (3.3%) was the leading factor.
To summarise, over-grazing was the leading cause worldwide, but different regions faced different challenges, with Europe being the most affected and North America the least.
Vocabulary
- Indicates
- Biggest factor
- Affected
- Mostly
- Leading factor
- Challenges
- Faced
- Globally
- Accounted for
- Different regions
Band-6 Answer
The pie chart shows why agricultural land loses productivity worldwide, and the table presents data about how different regions were affected in the 1990s.
From the pie chart, over-grazing caused 35% of land degradation, making it the biggest reason. Deforestation and over-cultivation accounted for 30% and 28%, while other reasons made up 7%.
The table shows that Europe had the highest total land degradation at 23%, mainly due to deforestation (9.8%) and over-cultivation (7.7%). Oceania had 13% of its land affected, mostly from over-grazing (11.3%), while North America had the lowest land degradation at 5%, with over-cultivation (3.3%) being the biggest factor.
Overall, over-grazing was the leading cause globally, but regional differences show that Europe suffered the most, while North America was least affected.
Vocabulary
- Shows
- Loses productivity
- Biggest reason
- Mainly
- Mostly
- Affected
- Different regions
- Suffered
- Lowest
- Leading cause
Connectors Used
- Overall
- According to
- In contrast
- Whereas
- Looking at
- Meanwhile
- To summarise
- Different from
- In terms of
- Compared to


 Here can be your custom HTML or Shortcode
0 Comments