Question:
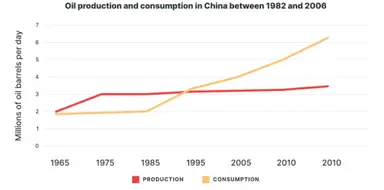
The line graph below shows the oil production and consumption in China between 1965 and 2025. Summarize the information by selecting and reporting the main features and make comparisons where relevant.

Band 9 Answer
The line graph illustrates the trends in oil production and consumption in China over a period spanning from 1965 to 2025. It is evident that both production and consumption have undergone significant changes, with notable divergence in later years.
In 1965, both oil production and consumption were relatively modest, reflecting China’s limited industrial activity at the time. Over the subsequent decades, production experienced a gradual but steady increase as the nation embarked on rapid industrialization. Conversely, consumption followed a similar upward trajectory initially; however, from the 1990s onwards, it began to accelerate at a much faster pace.
This acceleration in consumption can be attributed to China’s burgeoning economy and rising living standards, which led to an increased demand for energy. By the early 2000s, the gap between production and consumption started to widen noticeably, and projections for 2025 indicate that consumption will significantly exceed production. This divergence suggests that China may increasingly rely on imports or alternative energy sources to meet its growing needs.
Overall, the graph highlights the dynamic evolution of China’s energy sector, underscoring the challenges the country faces in balancing domestic oil production with soaring consumption levels.
Vocabulary
- Trajectory
- Burgeoning
- Modest
- Steady increase
- Accelerate
- Divergence
- Projections
- Reliance
- Industrialization
- Dynamic evolution
Band 8 Answer
The provided line graph compares oil production and consumption in China from 1965 to 2025. It shows that both production and consumption have risen considerably, although their growth patterns have diverged over time.
In 1965, the figures for both production and consumption were low. As China began to industrialize, oil production increased gradually while consumption also rose, albeit at a similar rate initially. From the 1990s, however, consumption started to grow much more rapidly compared to production.
This difference became more pronounced in the early 2000s, with consumption overtaking production. The trend is expected to continue into 2025, indicating that China may face a significant gap between its domestic oil supply and demand, possibly necessitating increased imports or alternative energy solutions.
In summary, the graph clearly demonstrates that although both oil production and consumption have grown, consumption has surged ahead in recent decades, reflecting China’s expanding energy needs.
Vocabulary
- Industrialize
- Considerably
- Risen
- Surged
- Overtaking
- Pronounced
- Domestic
- Necessitating
- Alternative energy
- Expanding
Band-7 Answer
The line graph shows how oil production and consumption in China have changed from 1965 to 2025. It is clear that both production and consumption have increased over the years, but the rate of increase for consumption is higher in recent times.
In 1965, both production and consumption were at low levels. As time went on, oil production increased steadily as China developed its industries. At the same time, oil consumption also went up, although not as fast at first.
From the 1990s, there is a sharp rise in oil consumption, which eventually becomes higher than oil production. The graph indicates that by 2025, the gap between consumption and production will have widened significantly, suggesting that China will have to import more oil or find other energy sources.
Overall, the graph clearly shows that while both curves are upward, the increase in consumption is more dramatic than that of production.
Vocabulary
- Steadily
- Sharp rise
- Widened
- Upward
- Developed
- Import
- Energy sources
- Levels
- Gap
- Significantly
Band-6 Answer
The line graph shows oil production and consumption in China from 1965 to 2025. In 1965, both production and consumption were quite low. Over the years, both numbers went up as China’s economy grew.
Oil production increased slowly at first and then more steadily as China began to develop its industries. At the same time, oil consumption also rose, but it did not increase as fast as production until later on.
From the 1990s, oil consumption started to rise very fast and began to be higher than production. The graph shows that by 2025, the amount of oil used in China will be much higher than the amount produced. This means that China might need to import more oil or look for other sources of energy.
Overall, the graph tells us that although both oil production and consumption have increased, oil consumption has grown much more quickly in recent years compared to production.
Vocabulary
- Economy
- Develop
- Steadily
- Risen
- Import
- Increase
- Fast
- Source
- Gap
- Much higher
Connectors Used
- However
- Moreover
- Meanwhile
- From the 1990s
- Overall
- In addition
- At the same time
- Eventually
- Thus
- Consequently


 Here can be your custom HTML or Shortcode
0 Comments