


Question:
The graph below shows the number of books read by men and women at Burnaby Public Library from 2011 to 2014. Write a report for a university lecturer describing the information shown below.
Band 9 Answer
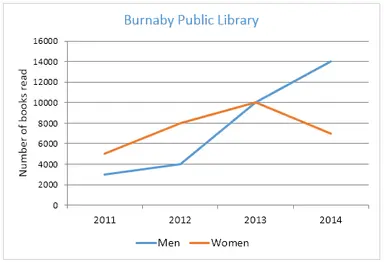
The graph illustrates the number of books read by men and women at Burnaby Public Library over a four-year period from 2011 to 2014. Overall, it is evident that women consistently read more books than men and that while the number of books read by women increased steadily, the figure for men declined gradually.
In 2011, approximately 15,000 books were read by men compared to around 20,000 by women. By 2012, the number for men had dropped slightly to about 14,000, while that for women rose to approximately 22,000. This trend continued in 2013, with men’s readership falling further to roughly 13,000 and women’s climbing to nearly 24,000. By 2014, the gap had widened noticeably, with men reading only around 12,000 books whereas women reached close to 26,000.
These figures indicate a clear divergence in reading habits over the period, with a downward trend for men and a marked upward trajectory for women. The data suggests that factors such as differing interests or time allocation may have contributed to the sustained increase in the number of books read by women, in contrast to the gradual decline observed among men.
Overall, the graph highlights a significant gender disparity in library usage, reflecting that women are progressively more engaged in reading compared to their male counterparts during the period in question.
Vocabulary
- Divergence
- Trajectory
- Marked
- Sustained
- Disparity
- Engaged
- Gradual decline
- Consistently
- Upward trend
- Notably
Band 8 Answer
The graph compares the number of books read by men and women at Burnaby Public Library between 2011 and 2014. It is clear from the graph that women consistently read more books than men, and while the number of books read by women increased over the period, that of men showed a slight decline.
In 2011, men read about 15,000 books, whereas women read around 20,000. By 2012, the figures changed to approximately 14,000 for men and 22,000 for women. In 2013, men’s reading numbers dropped to about 13,000 while women’s increased to roughly 24,000. By 2014, the gap widened with men reading around 12,000 books, compared to nearly 26,000 for women.
This data indicates that over the four-year period, women’s engagement with reading significantly increased, in contrast to the declining trend among men. The chart suggests that there may be underlying factors contributing to these differing trends in reading habits between the two genders.
Overall, the graph clearly demonstrates a steady rise in the number of books read by women, while the number for men experienced a consistent decline, underscoring a pronounced gender difference in leisure reading at the library.
Vocabulary
- Consistently
- Engagement
- Pronounced
- Underlying
- Differing trends
- Steady rise
- Decline
- Gap
- Comparative
- Leisure reading
Band-7 Answer
The graph shows the number of books read by men and women at Burnaby Public Library from 2011 to 2014. It is clear that women read more books than men during this period, and there is a noticeable change in the trends for both genders.
In 2011, men read around 15,000 books while women read about 20,000. In the following year, the number of books read by men decreased slightly to 14,000, whereas women’s reading increased to about 22,000. In 2013, the number for men further dropped to roughly 13,000, and women’s reading went up to around 24,000. By 2014, men’s numbers fell to about 12,000 and women’s rose to nearly 26,000.
This indicates that while the number of books read by women increased steadily over the years, men showed a gradual decline in their reading habits. The gap between the two genders widened over the period, suggesting that women are more engaged in reading at the library than men.
Overall, the graph demonstrates a clear difference in reading patterns between men and women at Burnaby Public Library over the four years.
Vocabulary
- Noticeable
- Engaged
- Gradual decline
- Steadily
- Widened
- Patterns
- Reading habits
- Differences
- Overall
- Trends
Band-6 Answer
The graph shows the number of books read by men and women at Burnaby Public Library from 2011 to 2014. It is divided into two groups: one for men and one for women.
In 2011, men read about 15,000 books while women read around 20,000. In 2012, the number for men went down to 14,000, and for women, it went up to 22,000. In 2013, men read roughly 13,000 books and women about 24,000. In 2014, the numbers changed to about 12,000 for men and nearly 26,000 for women.
This shows that over these four years, the number of books read by women increased, while the number read by men decreased a little. It also shows that women consistently read more books than men at the library.
Overall, the graph tells us that there is a clear difference between the reading habits of men and women, with women reading more books over the period.
Vocabulary
- Divided
- Increased
- Decreased
- Consistently
- Clear difference
- Reading habits
- Over the period
- Tells us
- About
- Roughly
Connectors Used
- Overall
- While
- Whereas
- In addition
- Furthermore
- By 2012
- In 2013
- Meanwhile
- Thus
- Notably


 Here can be your custom HTML or Shortcode
0 Comments