


Question:
The bar chart shows the percentage of young people in higher education in 2000, 2005 and 2010. Summarise the information by selecting and reporting the main features, and make comparisons where relevant.
Band 9 Answer
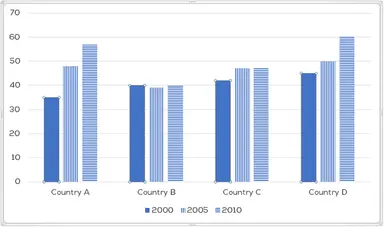
The bar chart illustrates the percentage of young people enrolled in higher education in four countries (A, B, C, and D) over three different years: 2000, 2005, and 2010.
Overall, the proportion of young individuals pursuing higher education increased in most countries over the decade. Countries A and D experienced the most significant growth, while Countries B and C showed relatively stable trends.
In 2000, approximately 40% of young people in Country A were in higher education. This figure rose steadily, reaching nearly 60% by 2010. A similar pattern was observed in Country D, where the percentage grew from about 45% to over 60% during the same period.
In contrast, the percentage of young students in higher education in Country B remained relatively unchanged, fluctuating around 40% across all three years. Meanwhile, Country C showed slight growth, with its figures increasing marginally from 42% in 2000 to just above 45% in 2010.
In summary, higher education participation saw notable growth in Countries A and D, while Countries B and C showed minimal change over the given period.
Vocabulary
- Higher education enrollment
- Significant growth
- Fluctuating
- Relatively stable
- Marginal increase
- Steady rise
- Notable growth
Band 8 Answer
The bar chart displays the percentage of young people attending higher education in four countries in 2000, 2005, and 2010.
Overall, the proportion of students in higher education increased in most countries, particularly in Countries A and D. However, Countries B and C exhibited only minor fluctuations.
Country A had around 40% of young people in higher education in 2000, but this number rose steadily to reach nearly 60% in 2010. Country D followed a similar pattern, increasing from approximately 45% to over 60% by 2010.
On the other hand, Country B maintained a relatively stable figure, with around 40% of students enrolled in each year. Similarly, Country C experienced only a slight increase from 42% to around 45% during the period.
In conclusion, Countries A and D witnessed a marked rise in higher education participation, while Countries B and C remained relatively unchanged.
Vocabulary
- Enrollment trends
- Minor fluctuations
- Relatively unchanged
- Marked rise
- Stable figure
- Exhibited a pattern
- Participation rate
Band 7 Answer
The bar chart compares the percentage of young people in higher education in four countries (A, B, C, and D) in the years 2000, 2005, and 2010.
Overall, Countries A and D saw an increase in higher education enrollment, whereas Countries B and C had little to no change.
In Country A, the percentage of students in higher education was about 40% in 2000, rising to around 60% by 2010. Similarly, Country D showed an increase from about 45% to slightly above 60% over the same period.
Meanwhile, Country B remained stable at approximately 40% throughout the years. Country C also showed a small rise, increasing from 42% to about 45% over the decade.
To sum up, there was noticeable growth in two countries, while the other two countries remained nearly the same.
Vocabulary
- Compare the percentage
- Had little to no change
- Remained stable
- Small rise
- Over the decade
- Enrollment rate
- Notable differences
Band 6 Answer
The bar chart shows how many young people were in higher education in four countries in 2000, 2005, and 2010.
Overall, Countries A and D had more students in higher education over time, while Countries B and C did not change much.
Country A had about 40% of students in 2000, and this went up to around 60% in 2010. Country D also increased from about 45% to over 60%.
On the other hand, Country B stayed the same at around 40% in all three years. Country C had a small increase from 42% to about 45%.
In short, two countries had big increases, but the others did not change much.
Vocabulary
- Stayed the same
- Went up
- Did not change much
- Over time
- Small increase
- Had more students
- Big increases
Connectors Used
- Overall
- On the other hand
- Meanwhile
- Similarly
- To sum up
- Over the same period
- Throughout the years


0 Comments