


Question:
The Pie charts below show some employment patterns in Great Britain in 1992.
Band 9 Answer
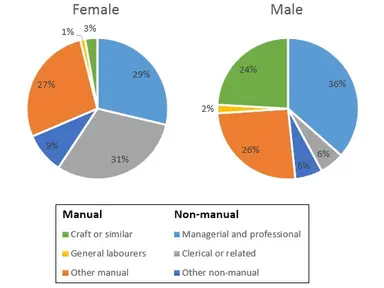
The pie charts illustrate employment distribution across various job categories in Great Britain in 1992, comparing male and female workers. Overall, non-manual jobs, particularly managerial and professional roles, were more prevalent among men, whereas women were more engaged in clerical work. Both genders had similar proportions in some manual jobs.
Looking at male employment patterns, the most significant category was managerial and professional roles, accounting for 36% of the workforce. This was followed by other non-manual jobs at 24%. General labourers and other manual occupations constituted 26% and 6%, respectively, while craft and similar roles were the least common at just 6%.
In contrast, female employment displayed a different distribution. Clerical or related jobs made up the largest proportion at 31%, whereas managerial and professional roles comprised 29%, slightly lower than their male counterparts. Other manual jobs accounted for 27%, making them a significant segment, while craft and similar roles were the smallest category at only 1%.
In summary, men were more concentrated in managerial roles, while women dominated clerical positions. Manual labour showed more gender balance, except for craft-related jobs, which were predominantly male.
Vocabulary
- Employment distribution
- Labour force
- Prevalent
- Constituted
- Proportion
- Workforce segmentation
- Gender disparity
Band 8 Answer
The two pie charts show employment patterns in Great Britain in 1992, categorizing jobs by gender. Overall, males were more likely to be employed in managerial and professional roles, whereas females had a higher proportion in clerical jobs. Manual jobs had a relatively balanced distribution.
Among men, managerial and professional occupations formed the largest category at 36%, while other non-manual jobs made up 24%. General labourers accounted for 26%, and clerical work represented only 6%. Craft-related jobs were the smallest segment at just 6%.
For women, the highest proportion was in clerical positions, at 31%, followed by managerial and professional roles at 29%. Other manual work was also a significant portion at 27%, while craft-related occupations were almost negligible, at just 1%.
In conclusion, men were more involved in professional and managerial roles, while women were largely in clerical jobs. Manual employment categories showed some balance between the genders.
Vocabulary
- Occupational trends
- Workforce segmentation
- Job distribution
- Significant proportion
- Relatively balanced
- Employment sector
- Notable distinction
Band 7 Answer
The pie charts compare the types of jobs held by men and women in Great Britain in 1992. It is clear that men had a higher proportion of managerial and professional jobs, while clerical work was more common among women.
For men, managerial and professional jobs made up the largest part of employment, at 36%. Other non-manual jobs accounted for 24%, while 26% were general labourers. Clerical work and craft-related jobs were the least common, each making up only 6%.
Women, on the other hand, had the highest percentage in clerical jobs, at 31%. Managerial positions were the second-largest category, with 29%. Other manual jobs made up 27%, while craft jobs were the smallest segment, with only 1%.
Overall, men and women were employed in different types of jobs, with men focusing more on managerial roles and women working in clerical positions.
Vocabulary
- Employment patterns
- Job sector
- Workforce distribution
- Manual work
- Proportion
- Employment category
- Labour market
Band 6 Answer
The two pie charts show the types of jobs men and women had in Great Britain in 1992. Men were more likely to work in professional jobs, while women mostly worked in clerical jobs.
For men, the biggest job category was managerial and professional, at 36%. The second biggest group was other non-manual jobs (24%), followed by general labourers (26%). Clerical and craft jobs had the lowest percentages, both at 6%.
Women had the highest percentage in clerical jobs, at 31%, followed by managerial jobs at 29%. Other manual work accounted for 27%, and the smallest category was craft jobs, with just 1%.
In general, men had more professional jobs, while women were more involved in clerical work.
Vocabulary
- Job types
- Work sector
- Employment figures
- Labour force
- Most common
- Percentage
- Work category
Connectors Used
- Overall
- In contrast
- Whereas
- Similarly
- Compared to
- In summary
- However


 Here can be your custom HTML or Shortcode
0 Comments