


IELTS Writing Task 1: Table Charts Explained
IELTS Writing Task 1 often includes interpreting table charts. These charts require you to analyze, interpret, and present data effectively in a concise manner. While the task may appear simple, a well-organized and analytical approach is crucial to maximize your score.
Table Chart in IELTS Writing Task 1
Table charts, also known as tabular graphs, are similar to IELTS bar chart in IELTS Writing. They require you to identify key data points, compare trends, and provide a coherent summary. It’s essential to use engaging vocabulary and focus on the most relevant data.
Structure for Writing Task 1 Table Chart
While there is no strict format, following a structured approach given below during the IELTS exam can help you create a clear and effective response:
Introduction:
- Paraphrase the description of the table provided in the question.
- Avoid copying exact wording and briefly state what the table illustrates.
Overview:
- Summarize the key trends or significant data points.
- Mention the highest and lowest values or consistent trends.
- Writing a separate paragraph for the overview is generally more appreciated, as it allows for better clarity and organization in your response. However, if you choose to merge the overview with the introduction, it is crucial to use appropriate IELTS Writing Task 1 connectors to ensure the flow and coherence of your writing.
Body Paragraphs:
- Paragraph 1: Highlight the first major feature or trend in the data.
- Paragraph 2: Discuss another key aspect or comparison.
Testing Criteria
Your response is evaluated on the following:- Accuracy in describing data.
- Ability to compare and contrast effectively.
- Clarity of explanation without including personal opinions.
- Use of appropriate tone and language.
Sample Table Chart Topics
Below are examples of IELTS table chart topics for IELTS Writing Task 1 you might encounter:- You should spend 20 minutes on this task.The table below gives information about past and projected population figures in various countries for different years. Summarize the information by selecting and reporting the main features, and make comparisons where relevant. You should write at least 150 words.
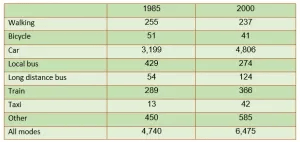
- You should spend about 20 minutes on this task.The table below gives information about changes in modes of travel in England between 1985 and 2000. Describe the information in the table and make comparisons where appropriate. Write at least 150 words.
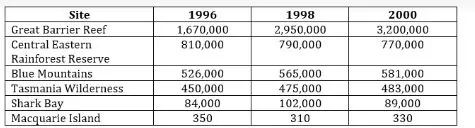
- You should spend about 20 minutes on this task.The table below gives information on visitor statistics for 1996,1998 and 2000 for various World Heritage sites in Australia. Summarize the information by selecting and reporting the main features, and make comparisons where relevant. Write at least 150 words.
- You should spend about 20 minutes on this task.The table below shows the number of medals won by the top ten countries in the London 2012 Olympic Games. Summarize the information by selecting and reporting the main features, and make comparisons where relevant. Write at least 150 words.
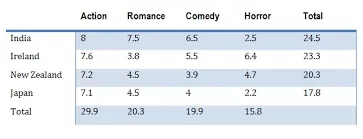
- You should spend about 20 minutes on this task.The table below shows the cinema viewing figures for films by country, in millions. Summarize the information by selecting and reporting the main features, and make comparisons where relevant. Write at least 150 words.


Strategies to Describe a Task 1 Table Chart in IELTS Writing
Effectively describing an IELTS table chart requires a systematic approach. Below, we outline four key strategies to help you craft a well-structured response.
-
Summarizing the Table
Start by analyzing whether the question refers to past, present, or future data, and tailor your response accordingly. Building a strong IELTS vocabulary will also enhance your ability to clearly articulate the trends and details within the table.
-
Dividing the Data
Segment the data into distinct sections for better clarity and understanding. Identifying unique data points can also add depth to your explanation.
-
Clearly Stating Your Point
The structure of your answer reflects your thought process. Consider dividing your response into paragraphs, each focusing on a specific main feature. This approach ensures that your points are clearly articulated and logically presented.
-
Compare and Contrast Data with Exceptions
Typically, use two paragraphs to detail the main features. Begin with a general overview in the first paragraph, delve into specifics in the second, and conclude with a comprehensive summary.
Tips for Interpreting a Table Chart for IELTS
Follow these IELTS Exam Preparation tips to effectively approach the table chart task in your IELTS exam:
- Highlight all the main features in your overview paragraph. Aim to include multiple features to achieve a high band score.
- Divide your explanation into separate paragraphs for better readability and organization.
- Focus on the main trends and details instead of attempting to cover everything in the table.
- Ensure your response is between 150-200 words. Writing less than 150 words will result in a penalty.
- Incorporate linking words to create a cohesive response and meet the word count efficiently.
- Avoid repeating words or phrases. Use paraphrasing techniques and maintain variety in your vocabulary.
- Adhere to proper IELTS Grammar rules and use relevant vocabulary to enhance the quality of your answer.
Top 3 Guidelines to Write a Good Answer for IELTS Tabular Chart
-
Maintain a Proper Structure
Your response should have a clear structure with an introduction, body paragraphs, and a conclusion. Use connective words to ensure your explanation flows smoothly and cohesively.
-
Use Appropriate Grammar and Vocabulary
Avoid repetitive sentences and opt for unique expressions. Employ a diverse vocabulary to articulate your points effectively.
-
Meet Task Requirements
Ensure your response is at least 150 words. Highlight the main features, trends, and significant data points in the table, and avoid including unnecessary details.
Successfully describing IELTS table charts involves summarizing, comparing, and contrasting data. Regular practice, along with a focus on key features and trends, will enhance your ability to craft clear and impactful responses. Aim for concise yet comprehensive answers to maximize your score.


 Here can be your custom HTML or Shortcode
0 Comments